Are you ready for higher interest rates?
Executive Summary
In this newsletter, we discuss interest rates and address the concerns of investors arising from historical low interest rates, the Fed’s ending of Quantitative Easing, and an environment of potentially rising interest rates later this year.
An important point to make is that rising interest rates do not necessarily have a negative impact for bond investors as often perceived. For one thing, an increase in interest rates is accompanied by higher interest payments over time. Even though the price of a bond fund may drop in value over the short-term, higher yields/rates could eventually help bond fund investors. While bonds are not as attractive as before, they have historically provided downside protection to portfolios. Bonds help you sleep better at night.
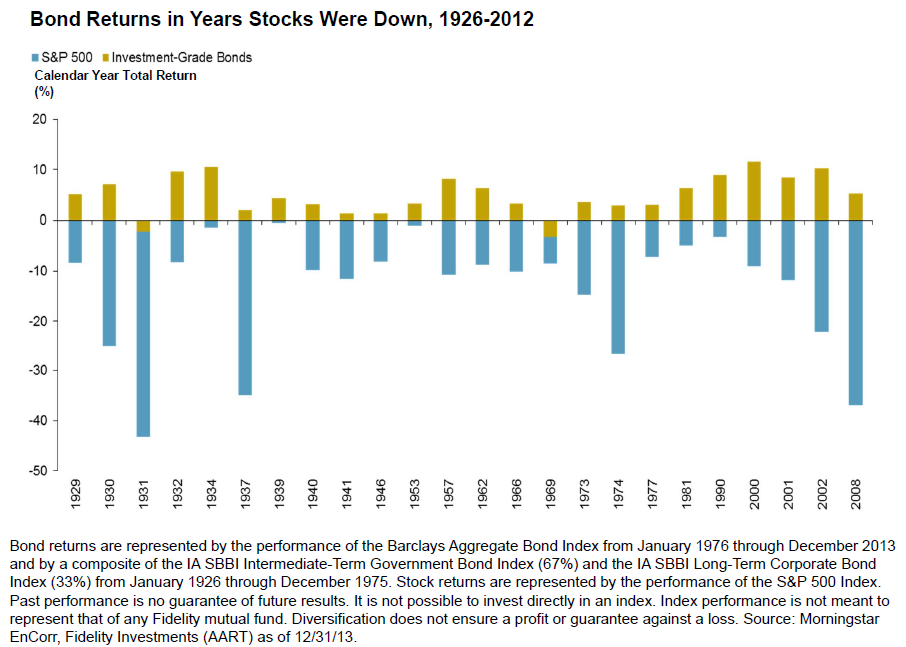
Another important concept is understanding how interest rates affect different asset classes (stocks, bonds...) differently and therefore, in order to hedge against rising interest rates, having a diversified portfolio becomes very important. Investing in other asset classes can help an investor mitigate the impact of an increase in interest rates on bond funds.
In order to reduce a portfolio’s sensitivity to interest rates, we recommend diversifying your fixed-income investments with shorter duration and global bond strategies.
Introduction
How would your bond fund perform if interest rates would go up by 1%? You would need to look at your fund’s duration (interest rate sensitivity) and yield. If your fund has a 4-year duration, your fund may suffer a 4% drop but the fund’s yield will offset portion of that drop.
Interest rates are one of the most important factors in determining a portfolio’s performance over time. It affects almost every asset class and has the potential to considerably affect an investor’s returns. Therefore, it is very important to take interest rate factor into account before making any investment decision. Sudden and drastic changes in interest rates can significantly impact your portfolio. Since the 2008 financial crisis, the U.S. Federal Reserve (Fed) has been playing a major role in driving the economy out of its troubles by injecting money in the economy (also known as Quantitative Easing) and by keeping the interest rates very low. One benefit is that we can borrow at very low rates. This allowed the investors to worry less about rising interest rates but we believe that will be changing in the next twelve months. With the Fed’s announcement in October 2014 of officially ending the Quantitative Easing period, as it believes the U.S. economy is back on track, investors have again become concerned about interest rates. Investors expect the Fed to raise interest rates in late 2015.
1. History of Interest Rates
To understand how interest rates play out in changing economic environments, we present the following chart.
10-Year Treasury Yields Since 1871

Source: Bourbon Financial Management, www.multpl.com; Data as of 12/31/2013
Over the past 30 years, investors have grown accustomed to receiving capital appreciation in addition to income from their fixed-income allocations.
Since 1994, there have been three periods of increasing federal funds rates. However, each of these periods has had unique factors that impacted the way fixed-income investments/investors responded.
Market Conditions during Periods of Increasing Fed Funds Rates

Sources: Bloomberg, www.federalreserve.gov, Barclays Live. Data shown applies to the actual time periods noted in the table.
Notes:1. Represented by the 10-Year Treasury yield 2. Yield difference between Barclays Corporate U.S. Investment Grade Bond Index and Barclays U.S Treasury Index. Change in Credit Spread Levels is measured from the beginning to the end of each period. 3. Yield difference between 2-year and 30-year U.S. Treasury securities measured at the beginning of each period.
Fixed Income Sector / Asset Class Performance
During the Three Most Recent Interest Rate Environments

Source: T. Rowe Price; Data represents the Citigroup 3-Month Treasury Bill, Barclays 1-3 Year Government/Credit Index, Barclays US Aggregate Index, Barclays US Mortgage-Backed Index, Barclays US Credit Index, CS High Yield Index, Barclays US TIPS Index (incepted 1997), and the Barclays Treasury Long Index
2. Factors Influencing U.S. Interest Rates
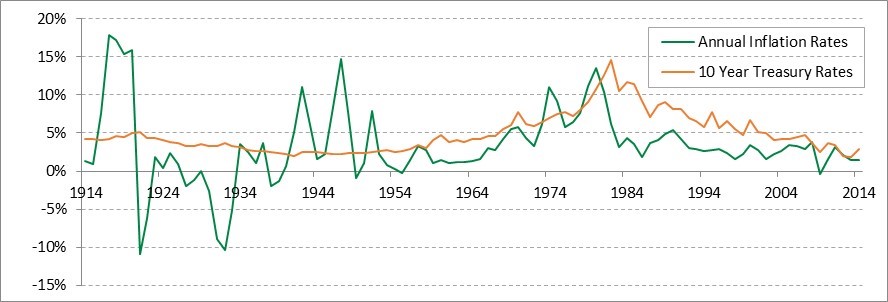
Inflation May Push Interest Rates Higher
A lender may be reluctant to lend money for any period of time if the purchasing power of that money will be less when it’s repaid; the lender will, therefore, demand a higher rate. Thus, inflation may push interest rates higher.
Interest Rates vs Inflation Rates
Source: Bourbon Financial Management, www.multpl.com, U.S. Inflation Calculator
Economic Conditions Affect Interest Rates
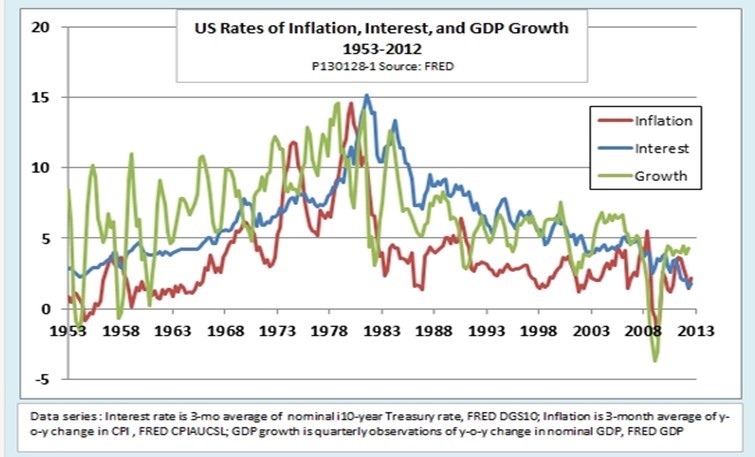
As we can see in the chart below, economic conditions impact interest rates. There seems to be positive correlation between economic performance and interest rate levels. This makes sense as improving economy puts consumers at ease and the general spending level increases, which translates into more borrowing from banks and other lenders. Thus, higher demand for funds results in increasing interest rates.
Interest Rate vs GDP Growth
Source: FRED
3. The Impact of Rising Interest Rates
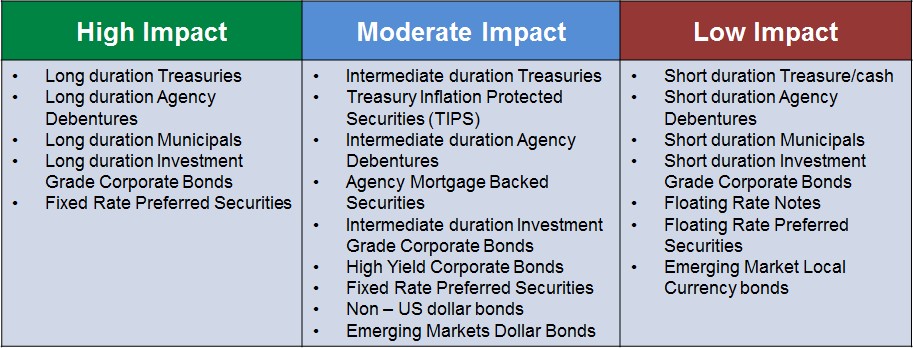
Relative Impact of Rising Interest Rates on Price of Fixed Income Securities
Other factors being equal, the fixed income investments in the “high impact” bucket are likely to experience the greatest price declines as interest rates rise, while the investments in the “low impact” bucket are likely to experience the smallest price declines as interest rates rise. In addition, factors other than interest rate changes—such as credit quality, leverage, call features and general economic conditions—may also affect the prices of particular fixed income instruments.
Source: UBS. As of 2013
Bond Prices and Interest Rates Have an Inverse Relationship
Bond prices generally rise (fall) as interest rates fall (rise), as demonstrated by the historic 5-Year U.S. Treasuries’ yield and price return.

Source: FactSet, Bank of America Merrill Lynch. Data as of September 30, 2014.
Are Rising Interest Rates Always Bad for Bond Investors?
It is a common perception that rising interest rates only bring bad news for bond investors. But we will try to show it’s not always the case.
In order to understand how much interest rates can actually impact our portfolio, we need to start with understanding the concept of duration.
The Longer a Bond’s Duration, the Greater Its Sensitivity to Interest Rate Changes, All Else Equal
Duration may seem like a complex calculation, but it is important to know the duration of your portfolio and try to keep it at an optimal level to hedge your investments against any drastic change in interest rates.
Interest rate duration measures the responsiveness of a bond’s price to interest rate changes. The values presented are approximate effects given sample durations across six scenarios of interest rate increases, assuming parallel shifts in yield curve.

Source: Bank of America Merrill Lynch, 2014. Note: Duration is a measure of a bond or bond portfolio’s price sensitivity to interest rate changes. Yield to Worst (YTW) is generally defined as being the lowest yield that a buyer can expect to receive. Figures are based on BofA Merrill Lynch Current 5-Year US Treasury Index.
Interest Payments Have Actually Helped Offset Negative Price Returns over Time
Coupon Returns Have Been Positive and Helped Offset Negative Price Returns
Rising interest rates often translate into higher interest payments over time. So, although the price of a bond fund may drop in the immediate term due to rising rates, over time, higher rates could eventually help bond fund investors.

Source: Barclays U.S. Aggregate Bond Index, as of 12/31/2013. Pay down returns, which are a component of the total returns, are not shown as a separate column. Note: In the past 15 years, price returns have been negative seven times, and in all but two of those years, the interest return helped to fully offset the negative price return
Income Has Dominated Return
Approximately 93% of total return has been generated by income rather than price movements. This is true for both high grade and high yield bonds. Income dominated total return even in the wake of the credit crisis, when high yield experienced a significant price rebound.

Source: Barclays. Data as of 3/31/14. Chart shows the percent of annualized total return derived from coupon return (as opposed to price appreciation). The Barclays Aggregate Bond Index has an inception date of 1/1/76. The Barclays U.S. High Yield 2% Issuer Capped Index has an inception date of 1/1/93. The index returns presented are for illustration purposes only and do not represent or predict performance of any Nuveen Asset Management product. Indices are unmanaged and unavailable for direct investment. Past performance is no guarantee of future results.
Income Drives Bond Fund Returns over Time
It may come as a surprise that the returns from a "passive" portfolio of fixed income investments has come almost exclusively from returns on interest payments from individual bonds, reinvested and compounded over time. Furthermore, more than 90% of the total return since 1976 generated from a broadly diversified portfolio of U.S. investment-grade bonds has come from interest payments, not change in price.

Source: Barclays. Returns shown are from monthly Barclays U.S. Aggregate Bond Index returns from January 1976 to December 2013. Total return equals income plus change in price with a reinvestment of interest payments.
4. The Strategies to Hedge Against Rising Interest Rates
Asset Class Performance during Rising Interest Rate Periods
One of the most effective strategies to hedge against interest rate risk is to diversify your portfolio by investing in different asset classes. As we mentioned before, interest rates affect different asset classes differently and therefore, diversification helps counter the change in one asset’s performance against other.
In the following few graphics, we show how rising interest rates period affected the different asset classes.
Rising Interest Rate Period 1: 2/1/94 – 2/28/95

Rising Interest Rate Period 2: 6/1/99 – 5/31/00

Rising Interest Rate Period 3: 6/1/04 – 6/30/06

Sources: Morningstar
Note: 1 Represented by Barclays Capital Mortgage-Backed Securities Index due to limited track record of the Barclays Securitized Debt Index.
In rising interest rate period 2, high yield corporates and preferred securities both experienced negative returns due to the volatile equity markets. Global bonds also experienced negative returns due to the impact of currency. When U.S. rates rise, the dollar tends to appreciate as higher rates are a positive factor for currency returns. However, short-term corporates had a good performance in this rising rate period. In rising interest rate period 3, all fixed income asset class experienced positive returns. Rates rose gradually over a long time period, with the Fed rising rates 17 times in small increments over a 24-month period.
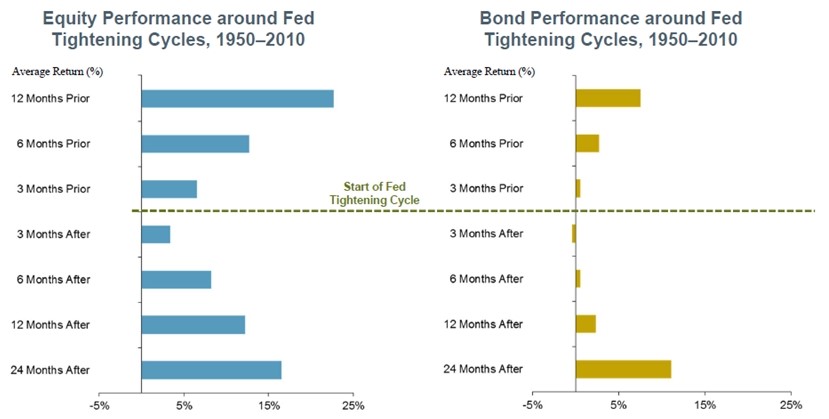
The Performance of Equity and Bond around Fed Tightening Cycles, 1950 - 2010
Source: Fidelity Investment (AART), data as of 9/30/2014. Note: Fed: Federal Reserve. Fidelity Investment proprietary analysis of historical asset class total returns, using data from indices from: Barclays, Fidelity Investment, Morningstar, Standard & Poor’s.
Fed tightening cycles means that the Fed will "make money tight" by rising short-term interest rates. Historically, U.S. stocks have posted solid returns prior to and immediately following the Fed’s first hike of a tightening cycle, with double-digit average returns one year ahead of and one year after the first rate increase. Bond performance has tended to slow prior to and just after the first hike, though returns have generally been solid two years later.
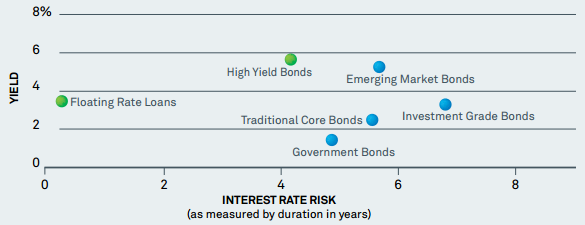
Finding Higher Yields with Less Interest Rate Risk
Low correlations to traditional core bonds make high yield and floating rate loans compelling strategic allocations and powerful fixed income portfolio diversifiers.
Yield to Maturity vs. Interest Rate Risk (Represented by Duration)
Sources: Barclays; Bloomberg; JPMorgan; S&P/LSTA, as of 12/31/13.
Outperformance of Bank Loans in Weak Treasury Markets
Bank Loans, or “Floating Rate Loans,” Have a Low Correlation to Treasury Prices and May Serve as an Effective Diversification Tool

Sources: Credit Suisse Institutional Leveraged Loan Index (represents senior-secured, U.S.-dollar-denominated non-investment grade loans), and the BofA Merrill Lynch U.S. 10-Year Treasury Index (measures the total return performance of U.S. Treasury bonds with a maturity greater than 10 years). The chart above shows every quarter since 1992 where 10-Year Treasury performance was negative, and the performance of the Loan Index in those same quarters.
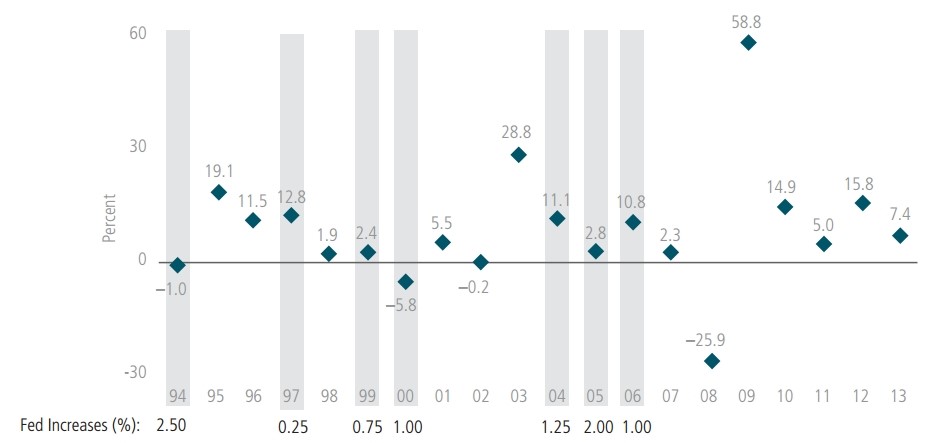
High-Yield Credit Has Been a Historically Strong Performer during Periods of Rising Interest Rates
Credit sectors—particularly high-yield bonds—have historically fared well in most periods of rising rates. Credit performance is linked to corporate fundamentals, which tend to improve when rates rise, offsetting some of the price decline. Income is also potentially available in many other sectors of the credit market beyond high-yield corporate bonds.
U.S. High-Yield Performance in Rising-Rate Environments 1994–2013
Source: Barclays, Bloomberg and Alliance Bernstein, as of December 31, 2013 US high yield by Barclays US High Yield 2% Issuer Capped. An investor cannot invest directly in an index and its performance does not reflect the performance of any Alliance Bernstein portfolio. The unmanaged index does not reflect fees and expenses associated with the active management of a portfolio.
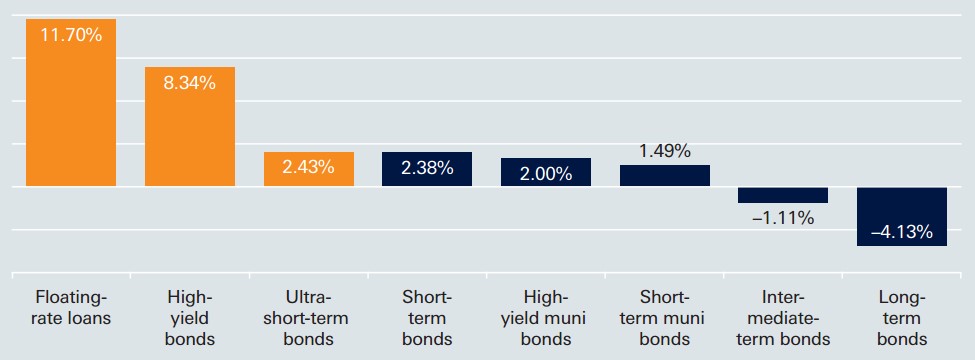
Ultra-Short Bonds, Floating-Rate Loans and High-Yield Bonds Outperformed When Interest Rates Have Risen by 1% or More
Compared to other fixed-income asset classes, floating-rate loans are typically less vulnerable to and are more sensitive to credit and default risks. Floating-rate loans are debt instruments with a variable rate that generally resets every 30 to 90 days. Because of their shorter maturities, short-term bonds are typically less vulnerable to rising interest rates than longer-term bonds. Short-term bonds offer a shorter length of time (about one to three years) until principal must be repaid. Short-term bonds typically have the least fluctuation of principal, followed by floating-rate loans and finally by intermediate-term bonds and long-term bonds, which typically have the most. Corporate bonds are subject to taxation; municipal bonds are generally free from federal income tax.
(Annualized Total Returns, 2/92–6/13)
Source: Morningstar as of 6/30/13
The Performance of Asset Class When Interest Rates Remain Unchanged and Increase over the 12-month Period
Three different hypothetical rate scenarios show how various taxable fixed income asset classes would perform over a 12-month investment horizon – first with no change in rates, and then with 50- and 100-basis-point (1%) parallel shifts along the yield curve. Each asset class is broken into short and long duration buckets. For example, the one-to-five year Treasury bucket is a sample portfolio of Treasury bonds maturing between 10 and 30 years.
In the case of both interest rate increases, shorter duration then outperforms longer duration across the board; if interest rates remain unchanged over the 12-month period, long duration outperforms short duration in every asset class.
12-month total return for a given parallel shift in the yield curve
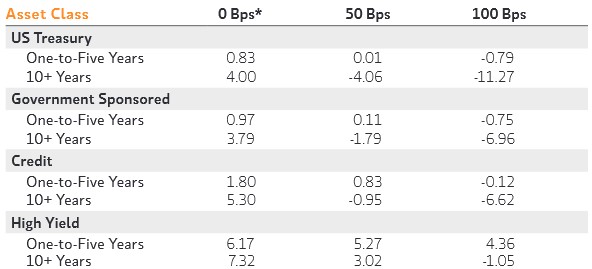
Note: A basis point is a unit of measure that describes the percentage change in a financial instrument. One basis point equals 0.01% of a percentage point. Source: the yield Book, Morgan Stanley Wealth Management as of June 14, 2013.
Short Duration Strategies
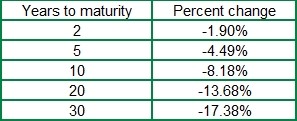
In anticipation of rising rates, investors can prepare themselves by reinvesting in shorter-maturity securities.
Longer-maturity securities can underperform when interest rates rise
Source: Wells Fargo Advisors
Bond Strategies
Bond investing requires assessing and balancing risk exposures, not return potentials. The 30-year decrease in interest rate (nice tailwind) will no longer be at your back. Return expectations need to be revised downward.
The Relationship between Yield and Standard Deviation (a Measure of the Volatility of Returns)
The Yield/Volatility Relationship
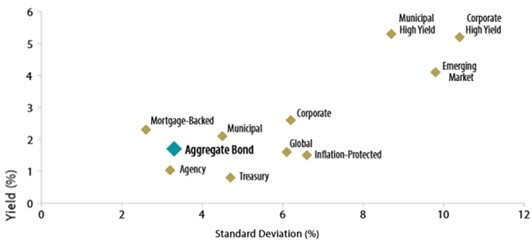
Source: Barclays; Bloomberg. Current yield measured as the yield to worst as of 4/30/13. Standard deviation calculated for the 10-year period ending 4/30/13. As of April 30, the Barclays U.S. Aggregate Bond Index has a current yield of 1.7% with a 3.3% standard deviation of returns. If someone wanted to achieve the 10-year historical average yield of 4% in this low yield environment they would have to consider Emerging Market Debt (4.1% yield), which carries three times the volatility.
Globally Oriented Strategies
Bond markets of different countries travel varied paths. A global strategy may reduce direct exposure to U.S. rates. Currency-hedged global bonds have historically captured greater upside when U.S. rates rise and less of the downside when rates fall. Currency volatility can be an unintended consequence of unhedged global bond exposure; hedged global bonds have delivered similar returns with less risk in the past
Global bonds can offer global diversification through non-US-dollar yield curves and currencies. Global diversification across countries, currencies and credit sectors can enable investors to potentially reduce risks during downturns in particular markets and to take advantage of differing business cycles and economic conditions around the world.
Bond that Invest in Many Countries May Help Reduce a Portfolio’s Sensitivity to Rising U.S. Interest Rates
Returns and UP/Down Capture Ratios (March 1990 – December 2013)
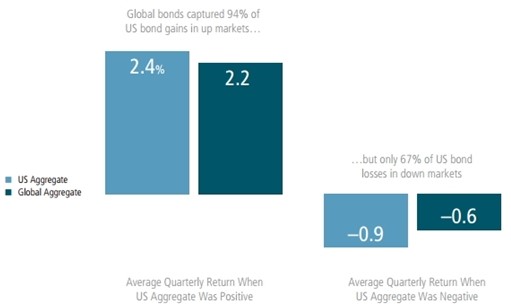
Source: Barclays and Alliance Bernstein. Data as of December 31, 2013
Note: Returns represented by Barclays US Aggregate Bond Index and Barclays Global Aggregate Bond Index Hedged to USD。An investor cannot invest directly in an index and its performance does not reflect the performance of any Alliance Bernstein portfolio. The unmanaged index does not reflect fees and expenses associated with the active management of a portfolio.
Relatively Higher Short -Term Yields Available Outside the United States
One important factor to consider when investing in global strategies is how currency risk is managed in a bond portfolio. Currencies can be volatile in their own right and will impact the total return of bond investments denominated in local currencies. At times, currency returns can even overwhelm bond returns.
Two-Year Government Bond Yields, As of June 30, 2014
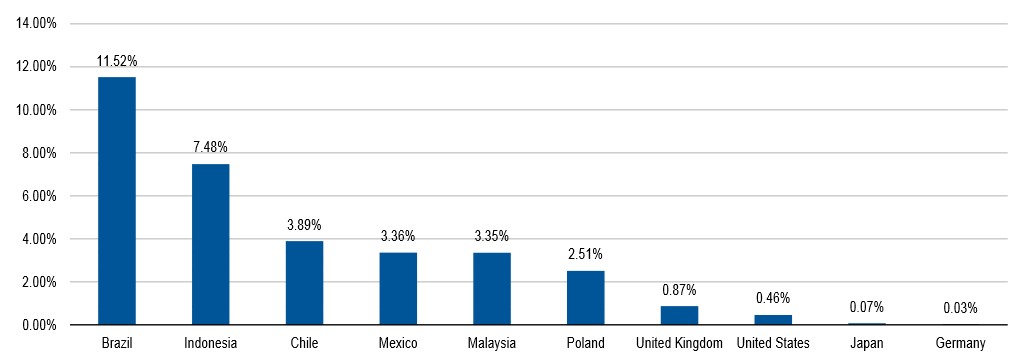
Source: Bloomberg, LP. Data as of 6/30/2014.
Investors Should Consider Individual Circumstances, Risk Tolerance and Investment Goals
When Making an Investment Decision.
These charts show sample fixed-income portfolios that offer a potential starting point for investors concerned about rising rates. Investors should consider individual circumstances, risk tolerance and investment goals when making an investment decision.


Source: Nuveen Asset Management, LLC. Data as of May, 2014.
Note: Sample Portfolios, Risk/Return, Portfolio Characteristics and Performance charts show hypothetical strategies.
Conclusion
We recommend effective strategies to lower potential interest risks: diversify your fixed-income investments, shorter duration bond strategies, and globally oriented strategies.
With these strategies in place, investors can be more confident of protecting their portfolios against any raise in interest rates. We also believe that rising interest rates will not necessarily have a negative impact on bond funds. Therefore, we still recommend diversified portfolios that include fixed income investments to offset the volatility of the stock portion of the portfolios.


We would welcome the opportunity to know you better, introduce ourselves, share with you the work we do for our clients, and position ourselves as a useful resource for you. It would be a wise first step towards achieving your vision.
Getting to know you, your needs and motivations, is almost as important as you evaluating our capabilities to help you meet your financial goals. We do not charge a fee for our initial consultation during which we review your portfolio, and listen to your goals and objectives.

What type of clients do we have? Our clients are located across the globe including North America, Europe and Asia. We have an unbiased approach in selecting our clientele i.e. our client base is broad encompassing expatriates, executives, entrepreneurs, working professionals, and business individuals. We welcome all clients from individuals with wealthy multi-million dollar portfolios to individuals who currently have negative net worth.
We have no portfolio size minimums.
Learn more about our straightforward flat fee conflict-free compensation model.

This newsletter was first published in March of 2015
https://us4.campaign-archive.com/?u=573d134676472fe56336c7f4f&id=ac2798ff9f&e=d68f9c2d38


